
 |
16LX Monitor Debugger for Single Chip Applications
|
|
Debug Code in internal Flash
|
|
8 KByte Monitor Kernel size
|
|
128 Byte internal RAM used by Kernel
|
|
Hardware Breakpoints
|
|
Debugging both C-Source Code and Assembler
|
|
Single Step, Step-In , Step-Out , Step-Over Function
|
|
Sending messages via RS232 to be displayed on a small terminal window
|
|
Dedicated Debug Windows
|
Watch Window (with optional update functionality)
|
|
Memory Window
|
|
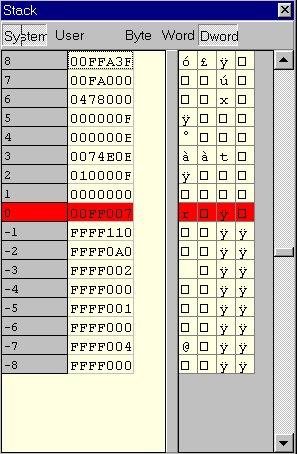
Stack Window
|
|
CPU Core Register Window
|
|
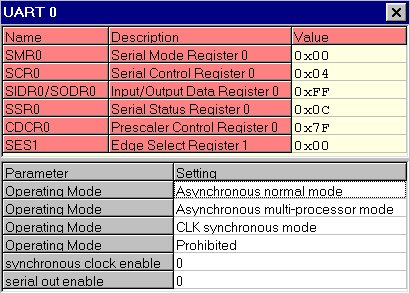
MCU Peripherals Window
|
Shows register contents of the internal MCU peripherals
|
|
|
|
Supported Devices:
|
Debugger will support:
MB90F497G, MB90F543G, MB90F546G, MB90F549G, MB90F591, MB90F394
|
|
|
Available in Q4/2001 and can be ordered via
|
|
The following figure shows the monitor debugger running on the MB90F497 series. Functions, variables, Interrupts and the used source modules are listed in dedicated windows on the left and right side of the source window. The source window allows a C-Source code and a mixed mode view (including also the assembler code).
The internal CPU register window allows checking and modification of the core registers. The flags of the PS register are shown separatly.

A separate window for user/system Stack is available to give more detailed stack information.
A special feature of this monitor debugger is the peripheral overview window, which shows the internal peripherals of the MCU. The window shows which I/O ports are used, the port direction and status. For the peripherals addional detailed resource windows exit, which allows the user to check and modify the internal register settings of dedicated peripherals.

The debugger software is running on Windows 95/98 and Windows NT/2000 and allows to download the debugger kernel and the application itself into the embedded Flash memory of the MCU. The standard communication is done via RS232. Communication via CAN is planned for future releases.
|